Start with a template
Pick a template, customize it with AI, and have a polished visual map in seconds. No blank canvas anxiety.
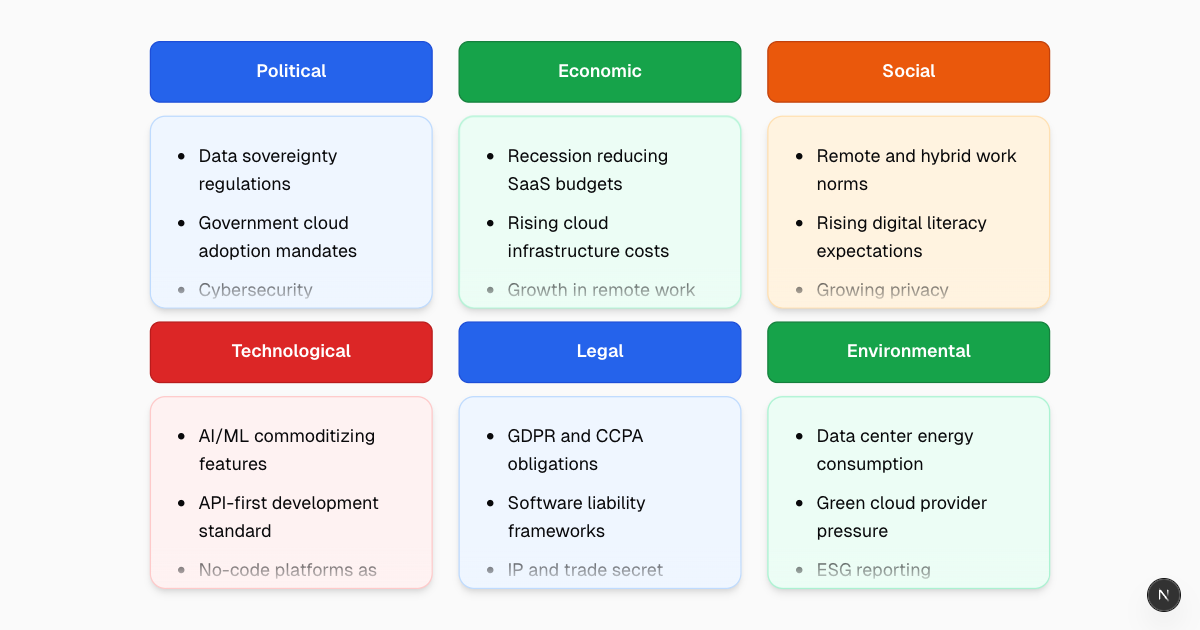
PESTLE Analysis
A 6-cell external environment analysis covering Political, Economic, Social, Technological, Legal, and Environmental factors for a SaaS startup.
Use templateMarket Comparison Bar Graph
A bar graph comparing market segments, product categories, or competitive metrics — with labeled axes, color-coded bars, and clear data labels for presentation-ready output.
Use templateCompetitor Market Share Bar Chart
A grouped bar chart comparing market share across five competitors in three regions — North America, Europe, and Asia Pacific with color-coded series.
Use templateSaaS Startup Lean Canvas
A Lean Canvas for a SaaS startup solving team communication overload — covering problem, solution, unique value proposition, unfair advantage, and key metrics.
Use templateSaaS Business Model Canvas
A complete Business Model Canvas for a SaaS project management tool — all nine building blocks from key partners and value propositions to cost structure and revenue streams.
Use templateTool Comparison Chart
A structured comparison chart evaluating tools or platforms across features, pricing, integrations, ease of use, and support — designed for informed procurement decisions.
Use templateExecutive Summary Dashboard
An executive summary dashboard presenting revenue, customer metrics, NPS score, operational KPIs, and strategic initiative status for leadership review.
Use templateHR Overview Dashboard
An HR overview dashboard tracking headcount, attrition rate, open positions, diversity metrics, and employee satisfaction scores across departments.
Use templateMarketing Analytics Dashboard
A marketing analytics dashboard tracking campaign performance, customer acquisition cost, channel attribution, conversion funnels, and ROI across marketing programs.
Use templateProject KPI Dashboard
A project management KPI dashboard tracking budget utilization, milestone completion, team velocity, and risk indicators across active projects.
Use templateSales Metrics Dashboard
A sales metrics dashboard tracking pipeline value, win rate, average deal size, sales cycle length, and rep performance across the sales organization.
Use templateInvestment Decision Tree
A decision tree for choosing investment options — branching by risk tolerance (conservative, moderate, aggressive) and time horizon (short-term vs long-term) to recommend specific instruments.
Use templateE-Commerce Order Processing Data Flow Diagram
A data flow diagram for an e-commerce order processing system — showing external entities, processes, data stores, and the flow of information from browsing to shipping.
Use templateHomebuyer Empathy Map
An empathy map for a first-time homebuyer using a mortgage app — capturing what they say, think, do, and feel during the mortgage application process.
Use templateCustomer Churn Root Cause Fishbone Diagram
An Ishikawa fishbone diagram analyzing root causes of increased customer churn — organized across six categories: Product, Support, Pricing, Competition, People, and Process.
Use templateDon't see what you need?
Just describe it. MyMap's AI will generate a custom map from scratch.
Start from scratch